When it comes to evaluating our corporate key figures, the Odoo ERP system provides us with a very good basis. With the mapping of our core and various sub-processes, all relevant key figures are already in the system. In addition, Odoo provides us with a reporting system in each module to illustrate and evaluate the key figures. The user decides whether he wants to display the key figures in graphical form, for example as a line, bar or pie chart, or in tabular form in a pivot view.
Furthermore, Odoo offers us the possibility of exporting data or key figures, which we can then evaluate with appropriate tools, such as MS Excel. With version 14, Odoo expands these possibilities with the Spreadsheet feature and paves the way towards a fully integrated business intelligence solution. So in today's blog, we take a look at Odoo Spreadsheet and introduce its basic features.
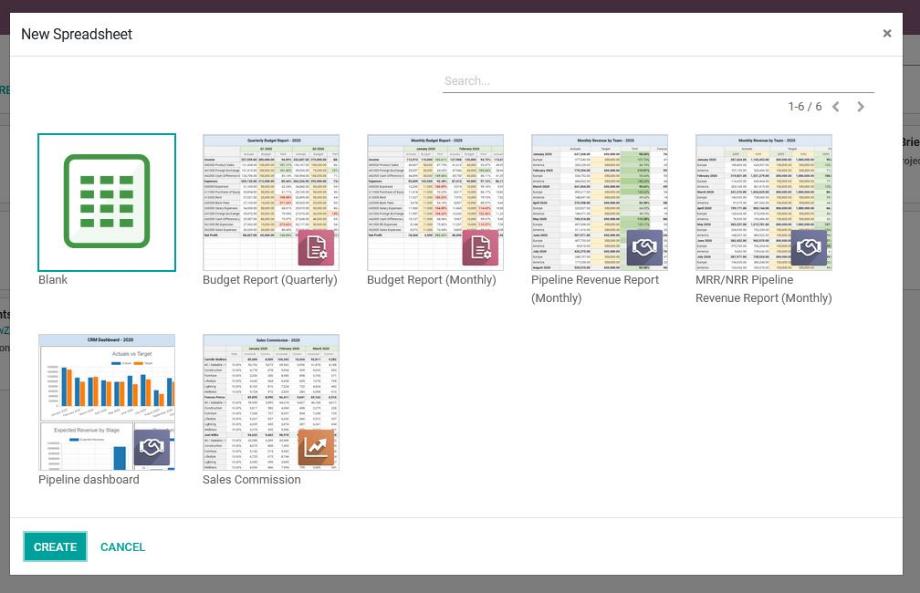
Odoo Spreadsheet can be used by any user in Odoo, so there is no restriction on access rights. The feature is based on the documents module. Here we find both a button for creating a new spreadsheet and a workspace where all spreadsheets are stored centrally. When creating a new spreadsheet, we choose between an empty file or a template. Odoo already comes with some templates by default. In addition, we have the option to create new templates. The small icons tell us which module is the database for the corresponding template.

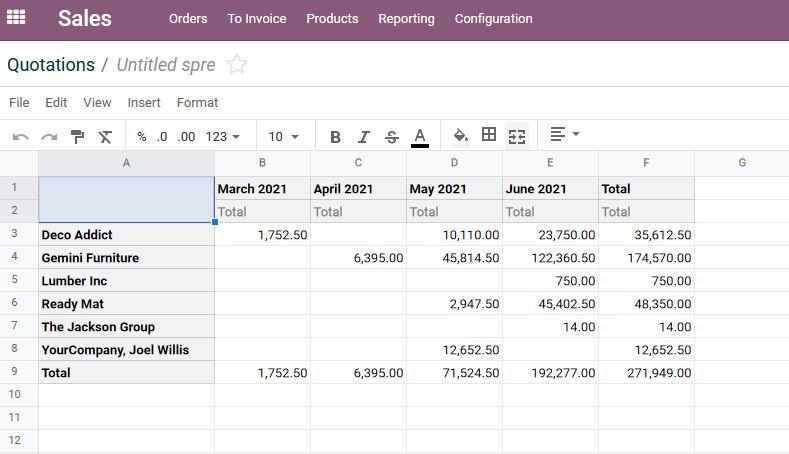
Alternatively, the spreadsheet feature is available in every module or in every reporting system. To do this, we use the filters in the desired object and look for exactly the information that is relevant for our evaluation. Then we switch to the pivot view, where we define the axes and create the spreadsheet with the "Insert in Spreadsheet" button.

At this point, the great advantage of the feature already becomes clear. Spreadsheet is fully integrated into Odoo and works with our real-time data. After creating our spreadsheet, we are therefore still in Odoo and can expand the table as we wish. If our data changes in Odoo, the data is updated analogously in Spreadsheet.

Once we have transferred the data into a spreadsheet, we can first customize the name of the document. Via a separate menu we find numerous options to save our spreadsheet, to save it as a template, to copy it or to edit it. For this, we have some functions familiar from various spreadsheet programs. For example, we can use them to format the text, color the background, highlight the frames, insert columns and rows or add entire spreadsheets.
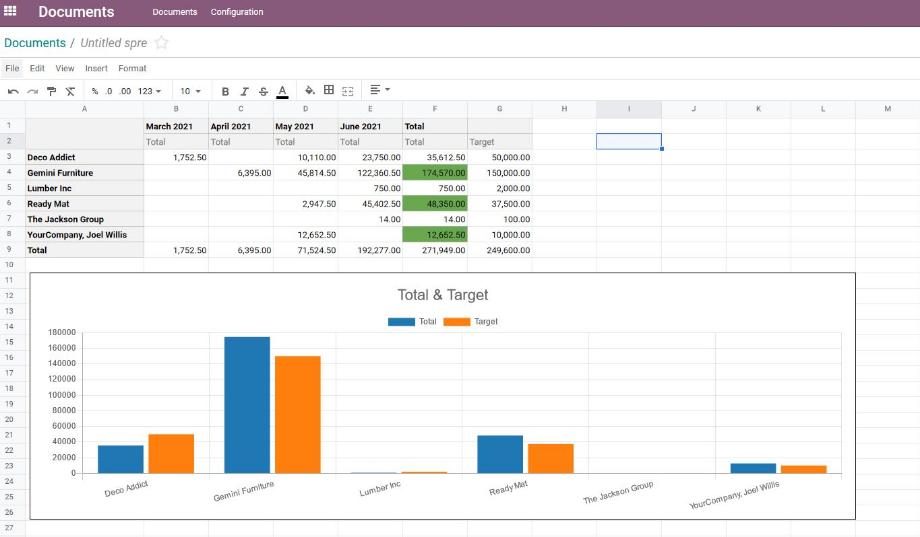
However, much more interesting for the processing and evaluation of our business key figures are the application of formulas as well as the optimized visualization of our data through conditional formatting or the use of graphical representations. This makes it possible, for example, to highlight individual cells in color if their value meets a certain condition, or to integrate entire areas into the spreadsheet as a line, bar or pie chart.

In addition to the functions already mentioned, there are other helpful features available to us that make our work in the spreadsheets easier. Using the filter icon on the upper right side we can define standard filters, which will then show us only the filtered values in the spreadsheet. We define the filters based on time ranges, data objects or a text.
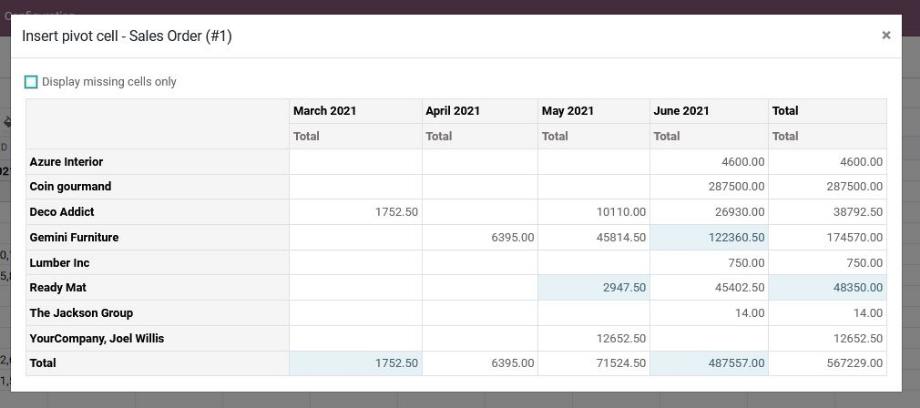
If we have accidentally deleted data in our spreadsheet, we can right-click on a cell and "Re-insert Pivot" to restore the entire spreadsheet. Alternatively, we can right-click on a cell and "Insert pivot cell" to restore the data of individual cells. Odoo shows us in a pop-up which cells have been deleted and their value.

With the Spreadsheet feature, Odoo thus takes a big step towards a business intelligence solution integrated into the ERP system and facilitates the further processing and evaluation of corporate KPIs. In doing so, the spreadsheets are available to us in all views that offer a pivot view. As a result, we can have the KPIs evaluated in all conceivable areas of the company and thus gain important insights from our existing data to support management decisions.
In terms of the next Odoo version 15, we can expect Odoo to improve the spreadsheet feature in terms of collaborative work and enable real-time collaboration. Thus, we will be able to recognize which users are also working in the document at which point. In addition, Odoo is probably extending the Spreadsheet with a formula wizard and a "Search & Replace" function. We will find out what other adjustments Odoo is making to the spreadsheet in October 2021 with the release of the new Odoo version.
Are you looking for an ERP system with which you can collect, evaluate and display your company key figures or do you have questions about the Odoo Spreadsheet? No problem! Contact us now and we will be at your side as a reliable Odoo partner!
Sources: www.odoo.com