In unserer Blogreihe zum Controlling für Beratungsprojekte wurden bereits die Einführung in das Projektcontrolling und die technische Umsetzung in Power BI unter Nutzung auf das zugrundeliegende Odoo-System beschrieben. Das Zusammenspiel der Systeme und der Durchlauf des ETL-Prozesses sind die Grundlage zur Aufbereitung eines aussagekräftigen Reportings und letztlich der Erreichung eines effektiven und effizienten Projektcontrollings.
Als letzter Schritt dieses Entwicklungsprozesses steht nun noch die Erweiterung um nötige Kennzahlen und eine ansprechende und effektive Visualisierung für das Management aus, um in Kürze aus der Vielzahl an Daten hilfreiche Erkenntnisse ziehen zu können.
Rückblickend und bezugnehmend auf den Power BI Workflow sind die Phasen Data Preprocessing und Data Modeling nun mit Ausnahme der Kennzahlenerweiterung abgeschlossen. Für eine einfachere Einordnung ist der Prozess über Power BI Desktop im Folgenden nochmals visuell dargestellt.

Mit den ersten beiden Phasen ist der im inhaltlich vorangestellten Blogbeitrag beschriebene ETL-Prozess an dieser Stelle bereits abgeschlossen, sodass alle nötigen Dimensionen in Hierarchieebenen und Faktentabellen mit Kennzahlen für eine mögliche Kennzahlenanreicherung, KPI-Entwicklung und Reporterzeugung bereitstehen.
Um das Ziel des Projektcontrollings für die Beratung zu erreichen, ist es vor der eigentlichen Erstellung der Reports notwendig, noch fehlende Kennzahlen aus den gegebenen Daten zu entwickeln. Über diese können schließlich mitarbeiter-, kunden- und zeitübergreifende Aussagen über die jeweiligen Beratungsprojekte und die allgemeine Performance abgeleitet werden.
In folgender Auflistung sind exemplarisch die für die Auswertung nötigen Kennzahlen samt deren Ursprung beschrieben. Die Liste ist keinesfalls als endgültig und/oder vollständig anzusehen, da sie je nach Bedarf modifiziert und insbesondere erweitert werden kann. Im Fokus steht vor allem die Abbildung kumulierter Kennzahlen, die die jeweils vorangegangenen Werte im ausgewählten Zeitraum berücksichtigen, um die Abbildung von Trends zu ermöglichen.
| Kennzahl | Kürzel | Beschreibung | Ursprung |
| Erlös kumuliert | Erlös_kum | Kumulierter Erlös über einen ausgewählten Zeitraum | Fakt Finanzen, Dimension Zeit |
| Aufwand kumuliert | Aufwand_kum | Kumulierter Aufwand über einen ausgewählten Zeitraum | Fakt Finanzen, Dimension Zeit |
| Delta kumuliert | Delta_kum | Ergebnis aus kumuliertem Erlös und Aufwand über einen ausgewählten Zeitraum | Kennzahl Erlös_kum und Delta_kum |
| Projektstunden kumuliert | PS_kum | Kumulierte Projektstunden über einen ausgewählten Zeitraum | Fakt Zeiterfassung, Dimension Zeit |
| Verrechnungssatz | VSC | Verrechnungssatz über einen ausgewählten Zeitraum | Dimension Kunde_manaTec und Mitarbeiter, Fakt Zeiterfassung, Kennzahl Delta |
| Verrechnungssatz gesamt | VS_gesamt | Quotient aus Delta-Wert und Projektstunden über alle Mitarbeiter und Kundenprojekte im ausgewählten Zeitraum | Dimension Kunde_manaTec und Mitarbeiter, Fakt Zeiterfassung, Kennzahl Delta |
| Verrechnungssatz kumuliert | VSC_kum | Kumulierter Verrechnungssatz als Quotient aus kumuliertem Delta und kumulierten Projektstunden über einen ausgewählten Zeitraum | Kennzahl Delta_kum und PS_kum |
| Projektbeitrag eines Mitarbeiters | Value | Verrechnungssatz multipliziert mit den jeweils geleisteten Projektstunden eines Mitarbeiters über einen ausgewählten Zeitraum | Fakt Zeiterfassung |
| Solltage | ST | Potenzielle Arbeitstage nach Arbeitsvertrag unter Berücksichtigung von Feiertagen | Fakt HR |
| Urlaubs- und Kranktage | UKT | Urlaubs- und Krankheitstage | Fakt HR |
| Anwesenheitstage | AT | Tatsächliche Anwesenheits |
Mit der Vervollständigung um die übrigen Kennzahlen steht der Erstellung von Auswertungen basierend auf den zugrundeliegenden Odoo-Tabellen nichts mehr im Wege. Die Reporterzeugung erfolgt in Power BI Desktop auf verschiedenen Berichtsseiten im letzten Prozessschritt der Data Visualization über die Report View des Tools.
Mittels Drag-and-Drop können hier die nötigen Reports erzeugt und jederzeit angepasst werden. Als Self-Service-Tool gestaltet sich die Nutzung sehr userfreundlich und intuitiv, sodass auch Anwender ohne BI-Kenntnisse problemlos nach einer kurzen Einarbeitungszeit umfangreiche Auswertungen anhand des bereitgestellten Datenmodells erzeugen können.
Schnelle und intuitive Reporterzeugung mit Power BI
In diesem Video zeigen wir, wie schnell es mit der Hilfe von Power BI und der entsprechenden Datenvorverarbeitung möglich ist, einen einfachen Report zu erzeugen.
Zum VideoAus den beschriebenen und erzeugten Dimensionen, Fakten und erweiterten Kennzahlen können nun die entsprechenden Reports aufbereitet werden. Die folgenden Beispiele sind ein Auszug der von der manaTec GmbH genutzten Reports für das Projektcontrolling und stehen exemplarisch für die mögliche Umsetzung in dem in dieser Blogreihe erläuterten Anwendungsumfeld.
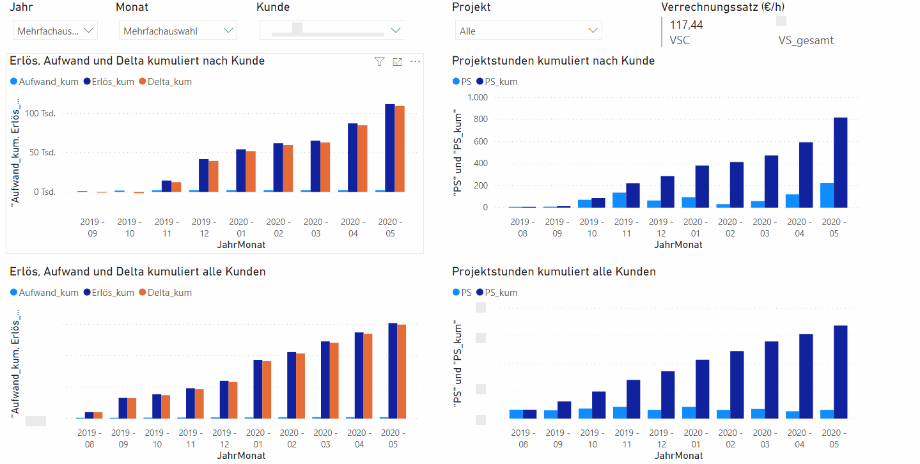
Entwicklung der Verrechnungssatzfaktoren
Einfache Gegenüberstellung der kumulierten Entwicklung von Projektstunden, Erlösen, Aufwendungen und des entsprechenden Deltas eines Kunden zur Entwicklung über alle Kunden auf Monatsbasis.

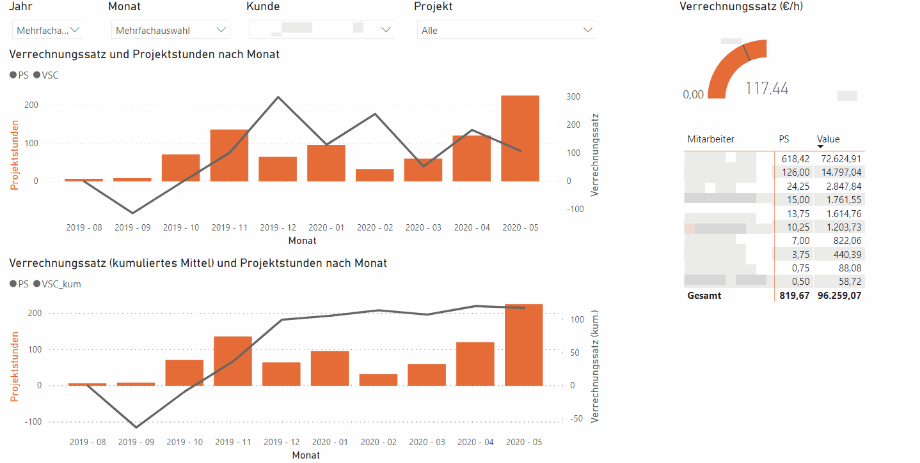
Entwicklung des Verrechnungssatzes
Entwicklung des kumulierten Verrechnungssatzes über einen ausgewählten Zeitraum unter Angabe von Projektstunden und in Gegenüberstellung zum Rechnungsdelta des jeweiligen Monats sowie des Projektbeitrags pro Mitarbeiter.

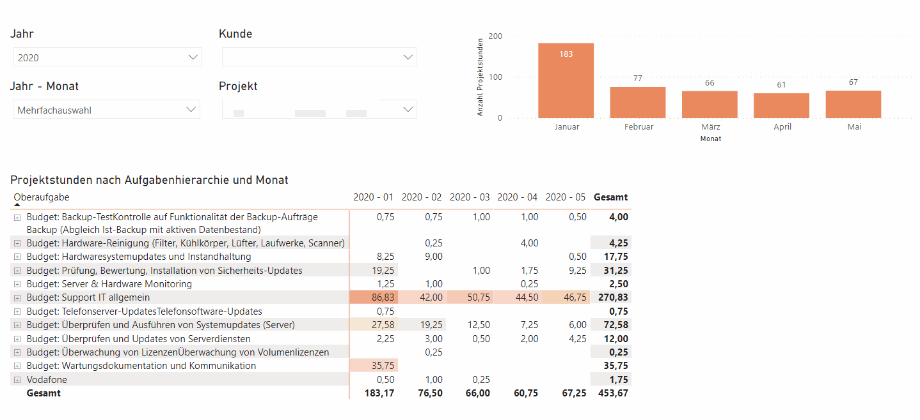
Aufgabenorientierte Auswertung der Projektstunden
Aufstellung geleisteter Projektstunden pro Aufgaben bzw. Oberaufgabe eines Projekts nach Monaten zur Berichterstattung an den Kunden.

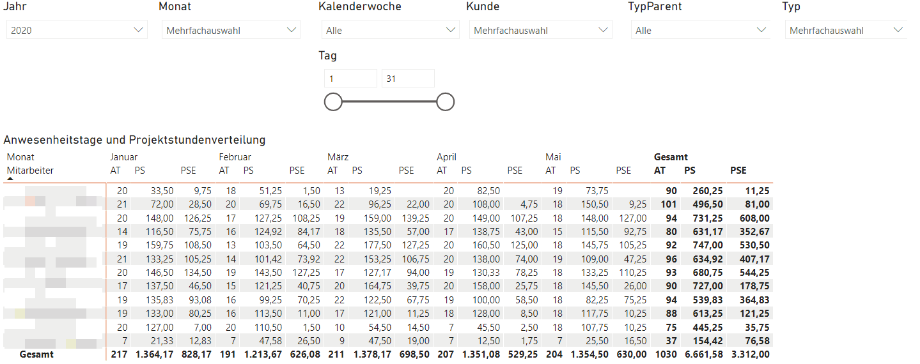
Anwesenheiten und Projektzeiten als HR-Auswertung
Entwicklung der tatsächlichen Anwesenheitstage sowie der internen und externen Projektstunden pro Mitarbeiter über die Monate eines Jahres als Datengrundlage für weitere HR-Auswertungen.

Durch die verschiedenen Berichte ist es möglich, einen Überblick über den Entwicklungsverlauf der Verrechnungssätze zu erhalten und mögliche Ausreißer rechtzeitig zu identifizieren. Dies gewährleistet die Ermittlung von Trends sowie die Identifizierung von etwaigen Stärken und Schwächen als Hinweis für punktuellen Handlungsbedarf. Neben dem rechtzeitigen Gegensteuern bei sichtbaren Fehlentwicklungen von Verrechnungssätzen auf Mitarbeiterebene oder Kundenebene wird so die Aufdeckung ungenutzter Potentiale ermöglicht.
Die Ermittlung von Top-Kunden und -Projekten sowie etwaiger Ursachen für Ausreißer von Verrechnungssätzen oder Rechnungsdeltas ist durch die parallele Gegenüberstellung mit Projektstunden, Erlösen und Aufwendungen jederzeit erkenntlich. Neben der Kundenperspektive wird die Beobachtung der individuellen Mitarbeiterentwicklung und Projektbeiträge gewährleistet, welche auch hier als Ansatz zur Identifizierung von Entwicklungspotentialen und zur optimalen internen wie externen Ressourcenallokation dienen kann.
Auch der ganzheitliche Blick auf die Unternehmensentwicklung, losgelöst vom Fokus auf den einzelnen Kunden, das einzelne Projekt oder individuelle Mitarbeiter, bietet hier einen Mehrwert in Form einer umfassenden Informationsbasis für strategische Entscheidungen. Weiterhin können vorgefertigte Standardreports zur Erfüllung der Kundenbedürfnisse beitragen - so beispielsweise über regelmäßige Auskünfte zur Verteilung der geleisteten Projektzeiten zur kundenseitigen Ermittlung von Kostentreibern.
Wie diese Blogreihe verdeutlicht, ist es möglich, das Ziel eines einfachen und flexiblen Projektcontrollings für Beratungsunternehmen vollständig und nachvollziehbar zu bewerkstelligen. Voraussetzung ist die lückenlose digitale Datenpflege, vorzugsweise in einem ERP-System, sowie ein passendes BI-Tool zur Verarbeitung und Aufbereitung der vorliegenden Daten.
Die Umsetzung bei der manaTec GmbH zeigt, dass das Zusammenspiel der modularen ERP-Lösung von Odoo als Datenquelle in Verbindung mit Microsoft Power BI, als ETL- und Reportingtool, eine effiziente und wirkungsvolle Symbiose bildet. Die Einbindung der über die Odoo-Module gepflegten Daten und die anschließenden Prozessschritte der Datenvorverarbeitung, -modellierung und -visualisierung gehen fließend ineinander über, sind hürdenfrei umsetzbar und bringen in Kürze die gewünschten Ergebnisse in Form anspruchsvoller und aussagekräftiger Reports für das Management. Nicht unerwähnt sollte bleiben, dass es die kostenfreie Nutzung von Power BI Desktop und der Odoo Community Version ermöglicht, eine solche Umsetzung frei von jeglichen Lizenzkosten zu realisieren.
Sie suchen nach einer Business Intelligence-Lösung für Ihr Unternehmen und haben Interesse an hilfreichen Tools wie Jedox oder Power BI? Kontaktieren Sie uns jetzt und wir stehen Ihnen als zuverlässiger Partner zur Seite!
Power BI & Odoo-basiertes Controlling für Beratungsprojekte