Im vorangegangenen zweiten Teil der Blogreihe "Evaluation von ERP-Projekten aus Beratungssicht" wurde erläutert, auf welcher Basis das Messinstrument aufbaut und wie die Erfolgsfaktoren über Kategorien, Kriterien und Indikatoren hierarchisch den vier Dimensionen Finanzen, Prozess, Kunden sowie Lernen & Entwicklung untergeordnet werden können. Nachdem die ersten beiden Blogbeiträge vor allem theoretischer Natur waren, soll es in diesem abschließenden Beitrag um die praktische Umsetzung und Visualisierung der Ergebnisse gehen. Dabei soll die Überführung der messbar gemachten Indikatoren in das Umfragemodul von Odoo und die anschließende Anbindung, Modellabbildung sowie Präsentation in Power BI im Fokus stehen.
Abbildung der zu messenden Indikatoren über Odoo-Umfragen
Mit der Operationalisierung der Modellindikatoren wurden parallel Fragebogen-Templates als Vorlagen erstellt, aus welchen unter geringen Anpassungen direkt Fragebögen abgeleitet werden können. Sie dienen daher zur Überführung der Indikatoren in die Umfragen der ERP-Umgebung. Die Fragebögen wurden dabei strukturell verglichen zur Messtabelle bzw. mit dem Ergebnis der Operationalisierung überarbeitet. Dies dient den Teilnehmern der Umfrage vor allem zur besseren Übersicht durch die Eliminierung alleinstehender Fragen pro Kriterium und zur besseren Nachvollziehbarkeit durch verständlichere Kriterienbezeichnungen. Inhaltlich sind die Indikatoren identisch geblieben, sodass sich für die Auswertung im Messinstrument prinzipiell keine Änderungen ergeben. Allerdings erfordert die Umstrukturierung ein Mapping der Odoo-Umfrage zum Messinstrument, damit die Wertursprünge der Umfrage entsprechend eindeutig dem Messinstrument zugeordnet werden können.
So sind nach Sicht und Ebene des Adressaten für die Befüllung des Messinstruments fünf Fragebögen zu erstellen:
- Kunde-Operativ,
- Kunde-Management,
- Beratung-Operativ,
- Beratung-Management,
- Gemeinsam-Management.
Die Erstellung der Fragebögen erfolgt mithilfe des Umfrage-Moduls von Odoo. Diese sind universell für jedes Projekt einsetzbar und liefern die Datenbasis für die Auswertung in Power BI.
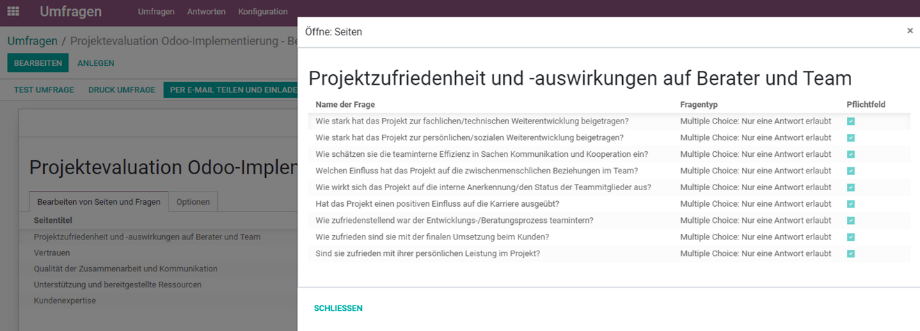
Da die Kunden im Kontakt-Modul von Odoo üblicherweise bereits hinterlegt sind, können nach erfolgter Überführung der Umfrage direkt Einladungslinks via E-Mail an die entsprechenden Ansprechpartner versendet werden. Im Beispielprojekt wurden fünf Umfragen generiert und an die Adressaten übermittelt:
- am Projekt beteiligte Berater und Manager mit Projektkenntnis von manaTec
- am Projekt beteiligte Key-User und Manager mit Projektkenntnis des Kunden
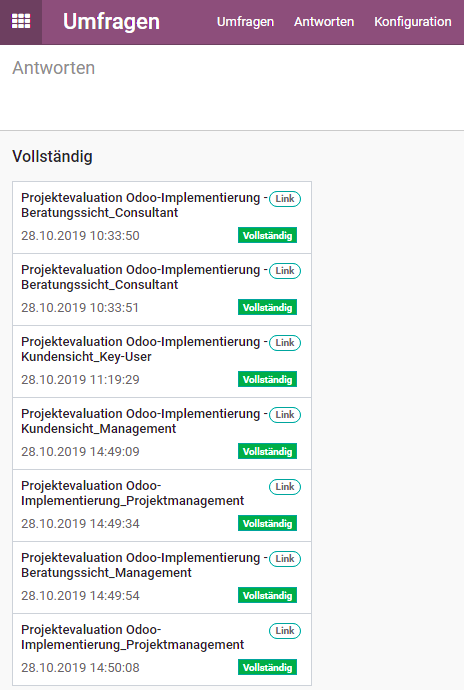
Nach Beantwortung aller Fragen durch die Adressaten sind die Umfragen als vollständige Antworten im Umfragemodul hinterlegt und die Auswertung gemäß dem Messinstrument kann beginnen.
Anbindung und Transformation der Tabellen in Power BI
Die Anbindung von Odoo in Power BI folgt grundlegend einem standardisierten ETL-Prozess. Dieser wurde bereits in der vorangestellten Blogreihe im Blog "Power BI & Odoo-basiertes Controlling für Beratungsprojekte - Controlling für Beratungsprojekte: die technische Umsetzung mittels Power BI und Odoo" näher beschrieben und wird daher an dieser Stelle nicht erneut ausführlich beschrieben. Genügen soll, dass die ETL-Schritte in Power BI (Data Preprocessing, Data Modeling, Data Visualization) die Datenvorverarbeitung, -transformation, -modellierung bis hin zur Visualisierung abdecken.
Mit der Anbindung der Tabellen befindet man sich in der Query View von Power BI und damit im Bereich Data Preprocessing, in welchem die Daten zudem bereinigt, verknüpft sowie aufbereitet werden. Es werden die entsprechenden Tabellen des Umfragemoduls der dem Odoo-System zugrundeliegenden PostgreSQL-Datenbank angebunden und für die anschließende Datenmodellierung bereitgestellt. Mit den Odoo-Versionen können sich Änderungen am zugrundeliegenden Datenmodell sowie in Strukturen der Tabellen selbst (neue, entfallene oder umbenannte Felder) ergeben, die teils signifikante Auswirkungen auf die Anbindung in Power BI haben. So entfallen am Beispiel dieser Integration in Version 13 verglichen zu Version 12 zwei angebundene Tabellen, wodurch sich der ETL-Prozess durch anzupassende Verknüpfungen entscheidend verändert. Für beide Versionen ist dennoch eine problemlose Integration unter Verwendung unterschiedlicher Power BI Projekte möglich.

Erstellung des Datenmodells und Datenanreicherung in Power BI
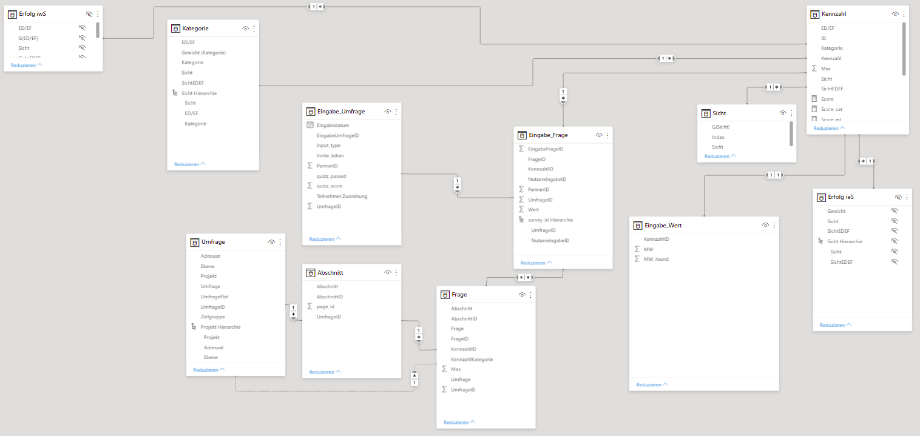
Sind die Tabellen angebunden und wie gewünscht transformiert, können diese über die Modeling View und Data View mit der Kennzahlenanreicherung, Ergänzung der Zeitdimension sowie Erstellung des Datenmodells vervollständigt werden. Diese Arbeit deckt den Schritt Data Modeling des in Power BI definierten ETL-Prozesses ab und ist der Berichterstellung direkt vorangestellt. Hervorzuheben sind dabei vor allem die erstellte Faktentabelle Kennzahl, in welcher sich alle über das Modell berechneten Kennzahlen wiederfinden sowie die Tabellen Sicht und Kategorie, die die von der BSC abgeleiteten Dimensionen und zugeordneten Unterkategorien enthalten und eine mehrdimensionale Auswertung ermöglichen.
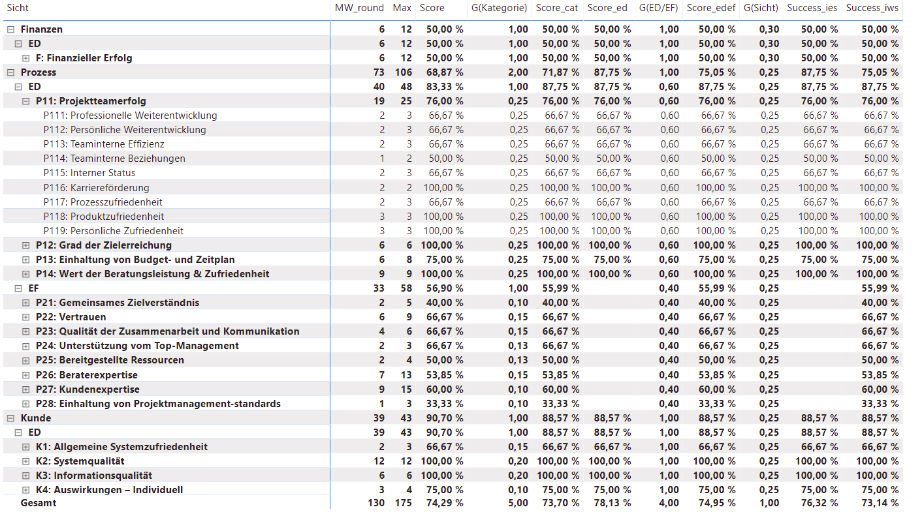
Die Kennzahlen werden entsprechend der Definition der Erfolgsbeiträge innerhalb der Kategorien und Dimensionen im Messinstrument berechnet. Innerhalb der Sichten wird der Ist-Wert des Indikators über das abgerundete arithmetische Mittel der Antworten gebildet, um jeder Sicht eine eindeutige Merkmalsausprägung zuordnen zu können. Zwischen den Sichten wird das arithmetische Mittel der beiden Werte aufgerundet, um dem Indikator für die Messtabelle eine eindeutige Merkmalsausprägung und einen zuordenbaren Ist-Wert übergeben zu können (in nachfolgender Tabelle ausgewiesen im Feld MW_round). Das Verhältnis dieses Ist-Wertes zum maximal möglichen Wert ergibt den Score des Indikators, der sich anteilig über die Kategorien, Sichten und Dimensionen auf den Projekterfolg auswirkt. Über einen der Berichte, die in der Report View von Power BI erzeugt werden, werden Scores detailliert bis auf Indikatorebene dargestellt, was gleichzeitig die Struktur des Messinstruments widerspiegelt, die im vorangestellten Blog "Evaluation von ERP-Projekten aus Beratungssicht - Einführung eines Messinstruments: Entwicklungsprozess und konzeptionelle Umsetzung" vorgestellt wurde.
Visualisierung über flexible Berichte und Dashboards in Power BI
Im Ergebnis können eine Vielzahl an Berichten auf Basis des Datenmodells erzeugt werden. Eine mögliche Form der Präsentation bietet die Darstellung des Projekterfolges als Kennzahl im engeren und weiteren Sinne, mehrdimensional als Netzdiagramm, in den einzelnen Sichten sowie unter Visualisierung der Kategorien, wie exemplarisch in der folgenden Abbildung dargestellt.
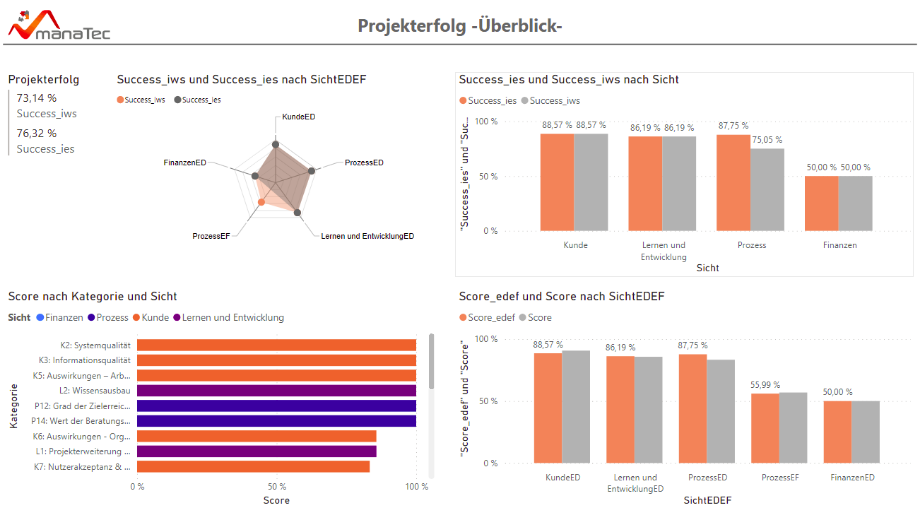
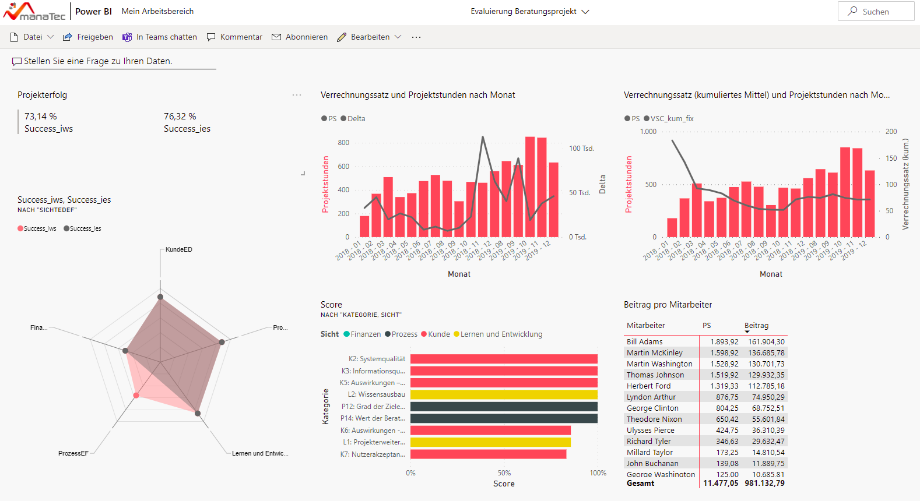
Über Power BI lassen sich mittels Dashboard Elemente verschiedener Reports flexibel miteinander kombinieren. In einer früheren Blogreihe unter dem Titel "Power BI & Odoo-basiertes Controlling für Beratungsprojekte - Controlling für Beratungsprojekte: Kennzahlenentwicklung und Reporting in Power BI" wurden bereits einige Reports im Bereich HR und Finanzen veranschaulicht, die mittels Power BI abbildbar sind und von der manaTec GmbH genutzt werden. Mit der Messung des Projekterfolges aus Beratungssicht und dem zugrundeliegenden Modell sind die finanzielle Sicht und interne Prozesse zwar bereits berücksichtigt, jedoch nur über den Fragebogen und die gewichtete Verrechnung in den Kennzahlen des Messinstruments.
Über ein Dashboard wäre es so möglich, explizite finanzielle Entwicklungen und Einflüsse von Beratern parallel zu den Elementen des Messinstruments abzubilden. So können, wie in der folgenden Abbildung zu sehen, die Entwicklung der Verrechnungssätze, die in der vorgenannten Blogreihe im Detail erläutert wurden, sowie die Wertbeiträge der Mitarbeiter zu einem Projekt neben den Projektkennzahlen dargestellt werden. Unabhängig vom Projekterfolg gelingt es so zu veranschaulichen, welche Mitarbeiter welchen Anteil an einem Projekt hatten und wie sich das Projekt finanziell im Verlauf entwickelt hat. Über Anomalien im Zeitverlauf könnten so beispielsweise Rückschlüsse gezogen werden, die sich auf besondere Merkmale des Projektes projizieren lassen.
Mit der nun geschlossenen Blogreihe wurde versucht, einen Einblick in den Entwicklungsprozess eines konzeptionellen Modells zur Evaluation von ERP-Beratungsprojekten zu gewähren, welches zudem als solches bereits in Anwendung bei der manaTec GmbH ist. Die Inhalte sollten im Allgemeinen Anknüpfungspunkte für Beratungen bieten, die Überlegungen anstreben, ihre Dienstleistungen intern zu evaluieren. Zudem ist die Umsetzung ein Fallbeispiel dafür, wie im Zuge der Entwicklung des Messinstruments eine erfolgreiche Kooperation von Wissenschaft und Praxis über ein reales Projekt umgesetzt werden konnte. Im letzten Abschnitt der Blogreihe soll zudem nochmals, wie schon in der früheren Blogreihe und insbesondere zum Thema "Power BI & Odoo-basiertes Controlling für Beratungsprojekte - Controlling für Beratungsprojekte: die technische Umsetzung mittels Power BI und Odoo" gezeigt, ein weiterer sinnvoller Anwendungsfall für das Zusammenspiel von Odoo und Power BI verdeutlicht werden. Im Endeffekt können über die Anbindung und Auswertung effektiv und effizient Mehrwerte geschaffen werden, die sich besonders in einer nachhaltigen Entscheidungsunterstützung ausprägen.
Haben auch Sie Interesse, Ihre Projekte intern auszuwerten oder suchen Sie nach an einer Business Intelligence-Lösung? Kontaktieren Sie uns jetzt und wir stehen Ihnen gerne als zuverlässiger Partner zur Seite!
Evaluation von ERP-Projekten aus Beratungssicht