In einer Ära, in der Daten als das neue Gold gelten, wird die Fähigkeit, Informationen effektiv zu nutzen, zu einem entscheidenden Wettbewerbsvorteil. Ab Version 16 bietet Odoo vielseitige Optionen zur Datenauswertung und ermöglicht Unternehmen somit nicht nur einen Überblick über komplexe Datenmengen, sondern auch maßgeschneiderte Auswertungen für die individuellen Bedürfnisse.
Die Rolle von Daten in der Geschäftswelt von heute
Die moderne Geschäftswelt ist zunehmend von der Fähigkeit geprägt, ncht nur Daten zu sammeln, sondern auch in Echtzeit darauf zuzugreifen, um schnelle und agile Entscheidungen zu treffen. Dashboards dienen als Schnittstelle, um komplexe Datensätze zu visualisieren und interpretierbare Einblicke zu gewinnen, wodurch die Bedeutung von Daten in der Geschäftswelt auf ein neues Niveau gehoben wird.
Dabei gleicht kein Unternehmen dem anderen, und somit variieren auch die Anforderungen an die Datenauswertung. Standardisierte Analysen können dabei oft nicht alle Nuancen erfassen. Vor dem Hintergrund werden ab Odoo 16 im Rahmen des Moduls Dashboards standardmäßig bereits eine Reihe vordefinierter Auswertungen zur Verfügung gestellt. Hierbei handelt es sich um über 20 Auswertungen aus den Themenbereichen Verkauf, Abonnements, CRM, Buchhaltung, Logistik, Marketing, Website und Personal.
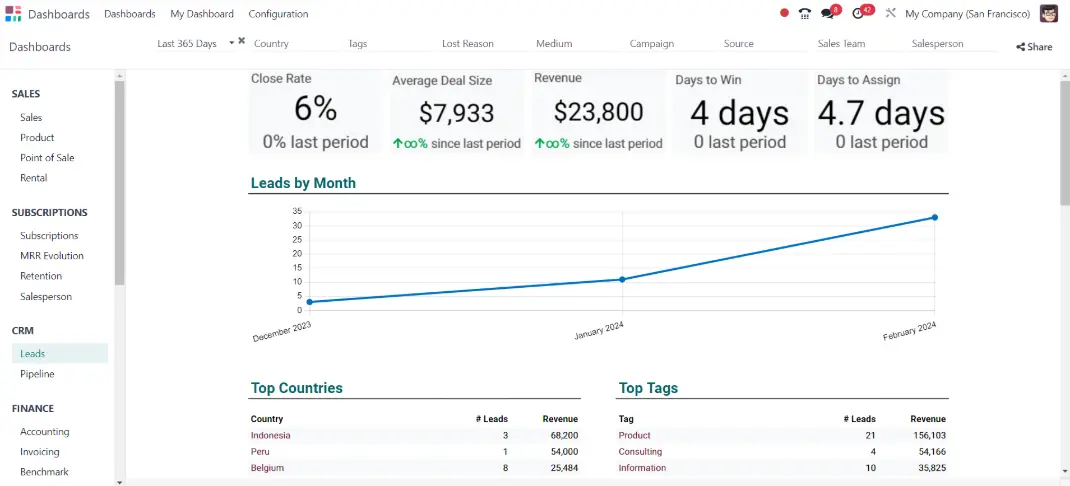
Damit Sie neben diesen vorgefertigten Auswertungen auch eigene Dashboards entwickeln und so das Modul in vollem Umfang nutzen können, werfen wir in diesem Blogartikel einen genaueren Blick auf die benutzerdefinierte Erstellung von Dashboards. Dafür versetzen wir uns hinein in die Rolle des Geschäftsführers eines mittelständischen Unternehmen, um an einem Praxisbeispiel zu verstehen, wie die Dashboards Unternehmen dabei unterstützen, ihre Daten in wertvolle Erkenntnisse umzuwandeln.
Odoo Dashboards - Ein Praxisbeispiel
Der Fokus unseres Dashboards soll auf den Kundenbeziehungen und um genauer zu sein auf den einzelnen Vetriebsmitarbeitern liegen. Vor diesem Hintergrund legen für vorab Ziele fest, welche wir mit unserem Dashboard erreichen wollen:
Zielsetzung
- Anzahl an Verkaufschancen je Vertriebsmitarbeiter
- Zu erwartende Umsätze je Vertriebsmitarbeiter
- Dynamisches Ranking der zwei besten Vertriebsmitarbeiter
Erstellung des Dashboards
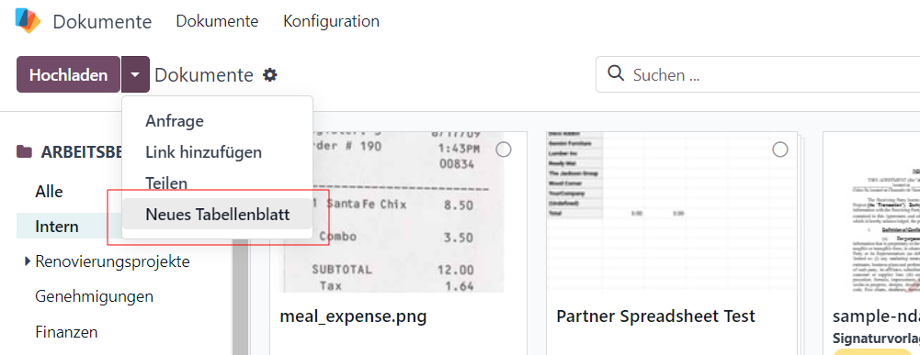
Um das Dashboards zu erstellen, wird neben dem Modul “Dashboards” auch das Modul ”Dokumente” benötigt, da in diesem Modul die sogenannten Tabellenblätter (auch Spreadsheets genannt) erzeugt werden, welche sich mit Excel-Tabellen vergleichen lassen. Der erste Schritt in der Erstellung des Dashboards besteht demnach darin, aus dem Modul “Dokumente” heraus ein leeres Tabellenblatt zu erstellen, welches die Basis unseres Dashboards darstellt.
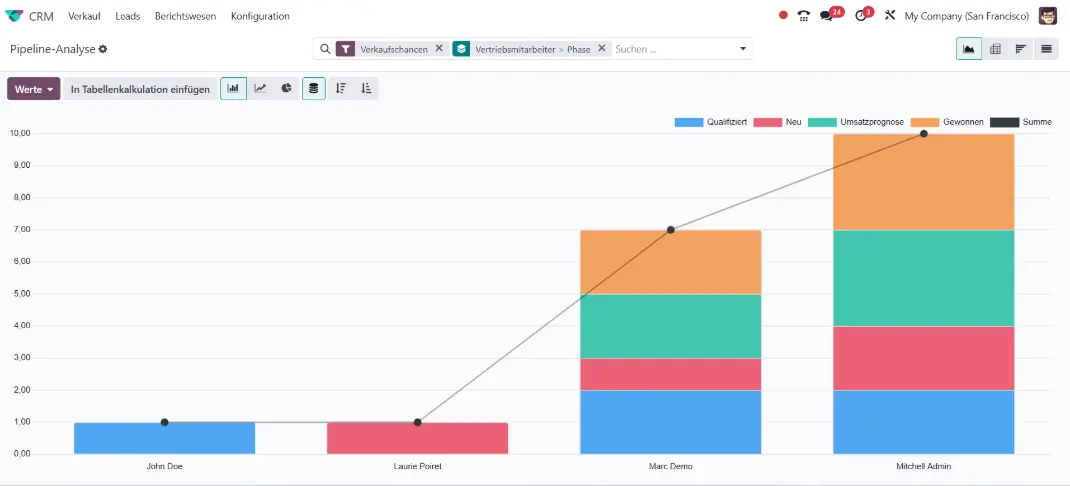
Im oberen Bereich des neuen Tabellenblatts kann direkt der Name angepasst werden - in diesem Beispiel nennen wir es “Verkaufsanalyse”. Um das Tabellenblatt mit den relevanten Informationen aus dem Odoo zu befüllen begeben wir uns in das Modul “CRM”, wo wir uns über den Reiter “Berichtswesen” die Verkäufe gruppiert nach dem Vertriebsmitarbeiter und der aktuellen Phase des Verkaufsvertrags als Graphen anzeigen lassen. Über die Schaltfläche “In Tabellenkalkulation einfügen” können wir den Graphen anschließend in unser erstelltes Tabellenblatt einfügen.
In der Tabellenkalkulation können wir das Diagramm anschließend nach Belieben über das Menü in der oberen rechten Ecke des Diagramms anpassen. In unserem Fall ändern wir den Namen des Diagramms und setzen die Legende in den unteren Bereich.
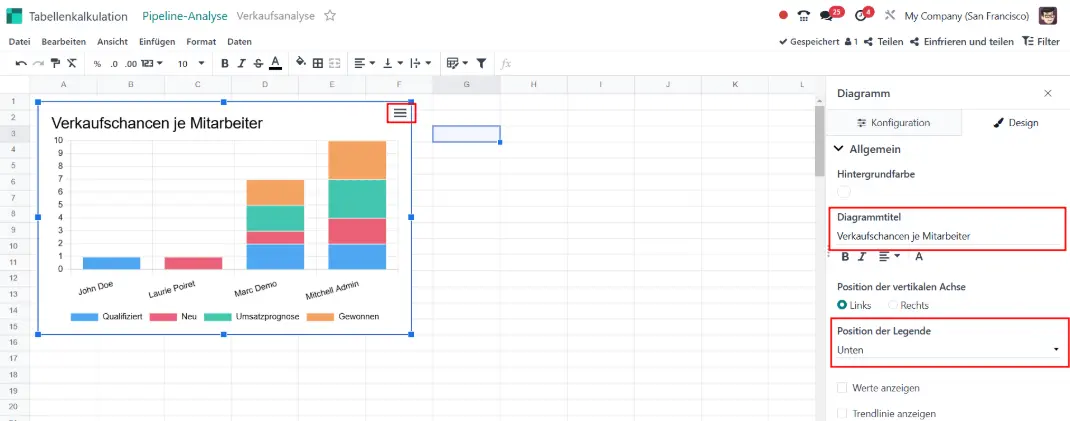
Dieses Diagramm gibt uns bereits einen guten Überblick über die Anzahl an Verkaufschancen der einzelnen Vertriebsmitarbeiter. Was wir allerdings nicht erkennen ist die Höhe der zu erwartenden Umsätze und ein übersichtliches Ranking der aktuell zwei besten Verkäufer. Um die dafür relevanten Daten zu erzeugen, bewegen wir uns zurück in das Berichtswesen des Moduls CRM und greifen dieses Mal nicht auf die Diagramm-Ansicht zurück, sondern auf die Pivot-Ansicht. Pivot-Ansichten finden eine sehr vielseitige Anwendung in Dashboards, da sie sich, anders als Diagramme, umfangreicher in der Tabellenkalkulation bearbeiten und auch mit weiteren Daten anreichern lassen.
In unserem Beispiel benötigen wir eine Ansicht der zu erwartenden Umsätze je Mitarbeiter und wählen demnach als Wert “Erwarteter Umsatz” aus und erweitern die Zeilen der Ansicht über das Plus-Symbol mit den einzelnen Vertriebsmitarbeitern. Anschließend sortieren wir die zu erwartenden Umsätze abfallend über den Pfeil neben der Spaltenbezeichnung.

Wie zuvor, fügen wir die Ansicht in unsere bestehende Tabellenkalkulation ein und sehen, dass für jeden weiteren Datenimport ein weiteres Tabellenblatt erstellt wird. Durch einen Klick auf einen Wert in der Pivot-Ansicht wird ersichtlich, dass Odoo nicht lediglich die Werte aus der erstellten Pivot-Ansicht in das Tabellenblatt ohne Formatierung einfügt, sondern jede Zelle auf den jeweiligen Wert der ursprünglichen Ansicht zugreift.
Bis Odoo 17 lassen sich durch die Manipulation dieser Zellbezüge Pivot-Ansichten relativ flexibel an die eigenen Anforderungen innerhalb des Spreadsheets anpassen. Diese Vorgehensweise wird ab Odoo 18 obsolet, da von dieser Version an importierte Pivot-Ansichten in Spreadsheets in sogenannte "Dynamische Pivot-Ansichten" überführt werden können. Dadurch ergibt sich eine ganze Reihe an neuen Funktionen, mit welchen die in Spreadsheets eingefügten Pivot-Ansichten weiterverarbeitet werden können.
Um eine solche Dynamische Pivot-Ansicht zu erzeugen, gibt es eine neue Funktion namens "Pivot", welche eine beliebige zuvor importierte Pivot-Ansicht als dynamische Version neu einfügt. Bei Bedarf kann in der Funktion unter anderem direkt die gewünschte Anzahl der Zeilen oder Spalten festgelegt werden.
Da unsere Zielstellung für das Dashboards eine Darstellung der zwei erfolgreichsten Vertriebsmitarbeiter vorsieht und der zu erwartende Umsatz immer absteigend dargestellt ist, können wir in mit der genannten Funktion die zu erzeugende dynamische Pivot-Ansicht direkt auf zwei Zeilen begrenzen:

Alternativ lässt sich dieses Ergebnis auch in älteren Odoo Versionen durch die zuvor angesprochene Manipulation des Zellbezugs der importierten Pivot-Ansicht erreichen. Hierzu setzen wir in der ersten Zeile sowohl in der linken als auch in der rechten Spalte ein Rautezeichen vor dem zu suchenden Element, um nicht nach einer bestimmten ID zu suchen, sondern nach einer Zahl. Diese Zahl ist die 1, da wir hier den Mitarbeiter an erster Stelle unseres Rankings definieren. Wir ändern die beiden Formeln also wie folgt ab:
Spalte “Vetriebsmitarbeiter”:
=ODOO.PIVOT.HEADER(1,"user_id",2) → =ODOO.PIVOT.HEADER(1,"#user_id",1)
Spalte “Erwarteter Umsatz”:
=ODOO.PIVOT(1,"expected_revenue","user_id",2) → =ODOO.PIVOT(1,"expected_revenue","#user_id",1)
Nachdem die Änderungen der Formeln für den Mitarbeiter der ersten Position umgesetzt sind, markieren wir die gesamte Zeile und ziehen die Formel bis an die zweite Stelle, damit die Formel für die zweite Zeile übernommen wird. Die Ansicht ist nun so konfiguriert, dass immer nur die besten zwei Vertriebsmitarbeiter nach dem zu erwartenden Umsatz angezeigt werden. Anschließend können in unserem Fall die restlichen Zeilen entfernt werden:

Die Pivot-Eigenschaften ab Odoo 18
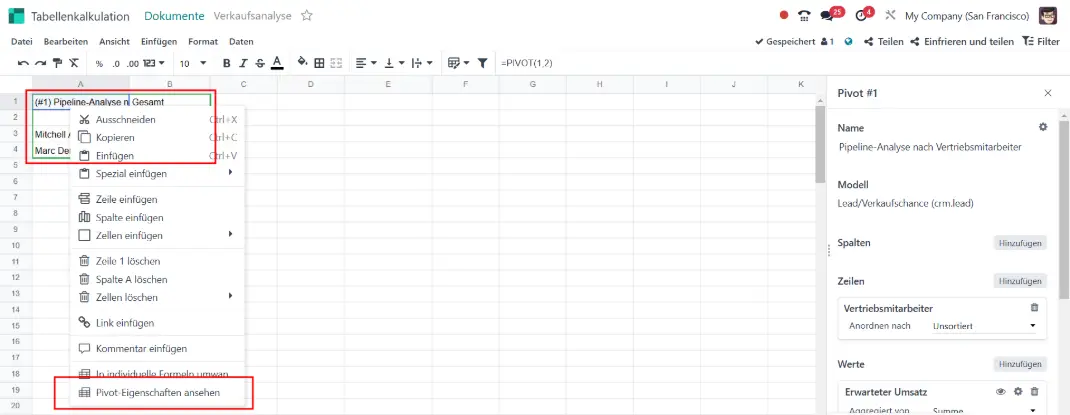
Mit einem Rechtsklick auf die dynamische Pivot-Ansicht lassen sich die Pivot-Eigenschaften öffnen. In diesem neuen Menü lassen sich ab Odoo 18 auf der rechten Seite umfangreiche Veränderungen an Pivot-Ansichten vornehmen. So können unter anderem weitere Spalten oder Zeilen eingefügt werden, Werte nachträglich sortiert werden oder auch benutzerdefinierte Berechnungen erstellt werden:
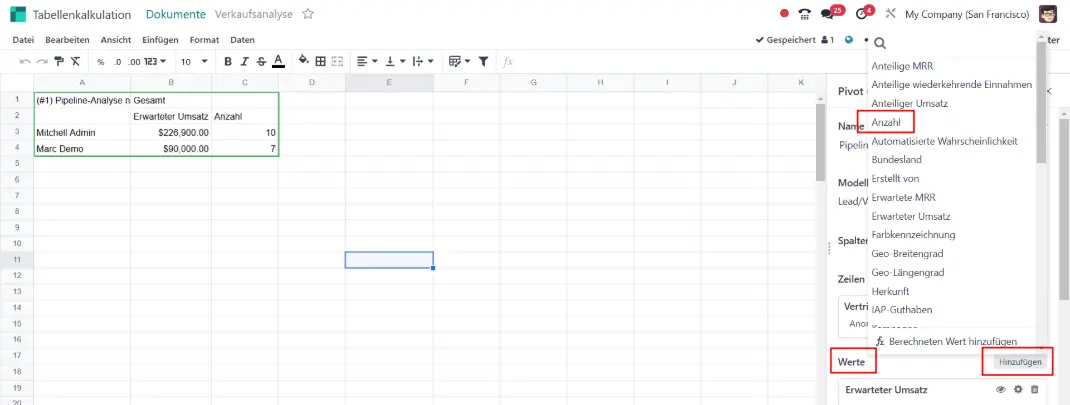
So können wir neben den zu erwartenden Umsätzen je Vertriebsmitarbeiter auch die durchschnittlichen Umsätze je Lead berechnen. Hierfür fügen wir zunächst eine neue Spalte für die Anzahl der Leads je Vertriebsmitarbeiter hinzu. Da die Anzahl der Leads keinem direkten Feld in Odoo bespricht, sondern bereits eine Berechnung darstellt finden wir sie unter dem Bereich “Werte”.
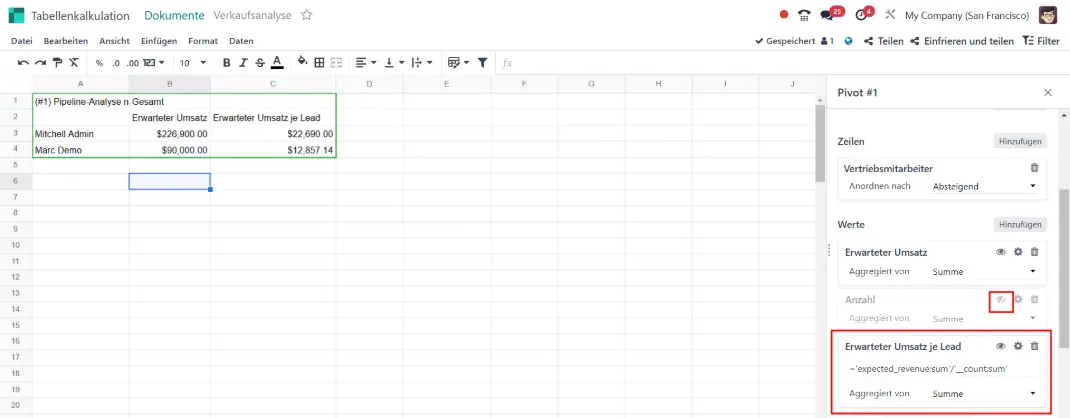
Neben der Auswahl von vordefinierten Werten lassen sich in diesem Bereich auch eigene Berechnungen erstellen. Um den durchschnittlichen Umsatz je Lead zu berechnen, erstellen wir also eine Berechnung, in welcher der Umsatz durch die Anzahl der Leads geteilt wird. Anschließend verbergen wir noch die Spalte über die Anzahl der Leads, da diese für unser Dashboard nicht relevant ist:
Natürlich lässt sich diese Berechnung auch über die gängigen aus Excel gewohnten Zellbefehle durchführen. Die Manipulation über die neuen dynamischen Pivot-Ansichten und dessen Eigenschaften hilft allerdings vor allem in komplexeren Berechnungen oder auch bei mehreren Ansichten auf einer Tabellenseite, die Übersicht zu behalten und schnell zu einem Ergebnis zu kommen.
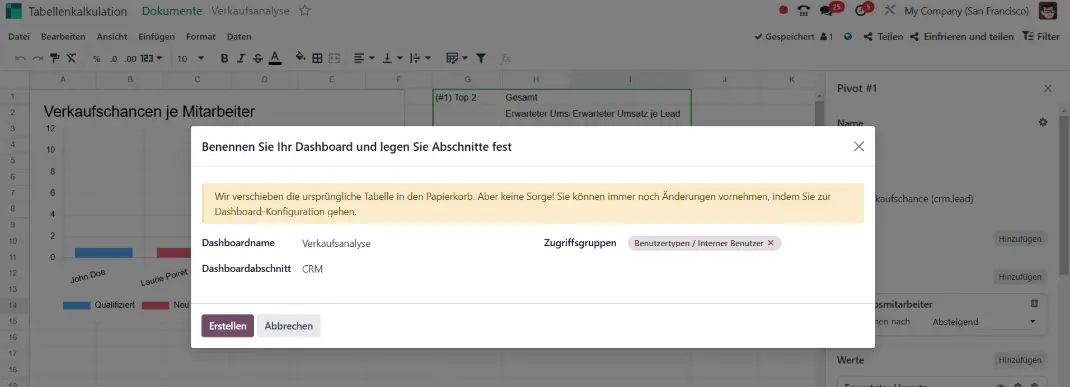
Da wir nun alle zu Beginn aufgestellten Zielvorgaben des Dashboards erfüllt haben, können wir die relevanten Inhalte für unser Dashboard zusammenführen. An dieser Stelle ist es wichtig zu erwähnen, dass im finalen Dashboard immer lediglich die erste Seite der Tabellenkalkulation im Dashboard angezeigt wird und somit alle relevanten Informationen dafür auf die erste Seite platziert werden müssen. Wenn das geschehen ist, wird das Tabellenblatt über den Reiter “Datei” und “Zum Dashboard hinzufügen” in ein neues Dashboard überführt. An dieser Stelle wählen wir den Namen des zu erstellenden Dashboards aus und platzieren das Dashboard in einer passenden Dashboard-Gruppe. Auch die Zugriffsrechte für das Dashboard können hier eingestellt werden.
Wir verlassen nun das Modul Dokumente und begeben uns in das Modul Dashboards, wo wir auf der linken Seite von den zu Beginn erwähnten standardmäßig enthaltenen Dashboards begrüßt werden. Unser in diesem Blogbeitrag erstelltes Dashboard kann nun im Bereich “CRM” geöffnet werden.
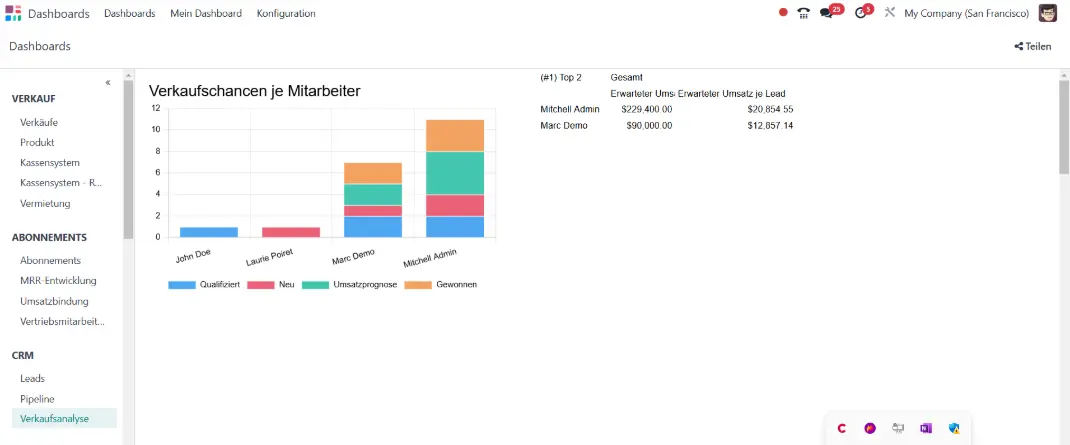
In diesem Blog haben wir die grundlegenden Schritte für die Erstellung von eigenen Dashboards an einem einfachen Beispiel aufgezeigt. Falls auch du ein auf deine Bedürfnisse zugeschnittenes Dashboard in Odoo benötigst oder auf der Suche nach Unterstützung bei der Erstellung eines komplexeren Dashboards mit den neuen Funktionen aus Odoo 18 bist, kontaktiere uns gern! Wir bieten darüber hinaus auch die Entwicklung von Auswertungen und Dashboards mittels Microsoft PowerBI an, um auch komplexere Daten aus mehr als einer Quelle zu vereinen.
Quellen: www.odoo.com
Odoo Dashboards